
What is Pitch?
So I stumbled onto a YouTube video: Chanel Tres and James Blake making music in the studio. James Blake picked up a modular synthesizer, boxes patched together with cable, and built a short, looping melody, glitchy, almost out of tune, like two square waves rubbing against each other on each note. They added a 4-on-the-floor drum pattern, then a quick keyboard stab, then a slippery, rubbery bass line. Lastly, they laid a simple chord progression over the whole awkward thin. Electronic, but soulful. It carried a vibe, the way a good house track does.
Naturally, I wanted to try it.
So I grabbed my Softpop 2, triggered some notes, and built my own glitchy loop. I hated it, the notes sounded out of tune. Tried retunning it, followed the tuning steps in the manual, reset the unit. no changes.
I couldn't tell the notes on the loop. I grabbed the nearest tuner around; No help at all. Sometimes it just showed a blank screen. Sometimes it showed two different pitches for the same note, one run to the next. I guess it made sense, my melody used glitchy square waves with pitches sliding around. That's genuinely a hard thing for any tuner to read. But it left me stuck on a question I couldn't shake: what is pitch?
Defining Pitch
Pitch turns out to be surprisingly hard to explain, so let's start somewhere more palpable: air, vibrating.
Imagine something, a guitar string, a bell, a stick hitting the pavement, getting struck and moving back and forth x times a second. The air pushes and pulls at your eardrum at that same rate. That vibration rate is what gets called an audio frequency, a physical measurement of vibrations per second. If the vibrations coming off a piano A4 key go back and forth 440 times per second. This is usually written as 440hz. The "hz" stands for Hertz, which is just the unit of measurement we use for that vibration.
This vibration rate is called frequency.
Pitch shows up after that. The experience your brain has of the frequency is the pitch, the name we slap onto "vibrating fast" versus "vibrating slow". The higher the frequency, meaning more vibrations per second, the higher the pitch.
Need for Speed
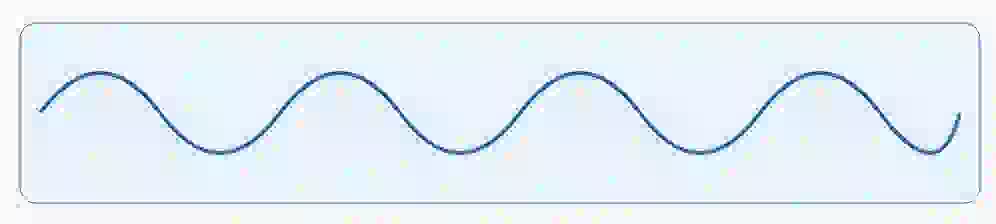
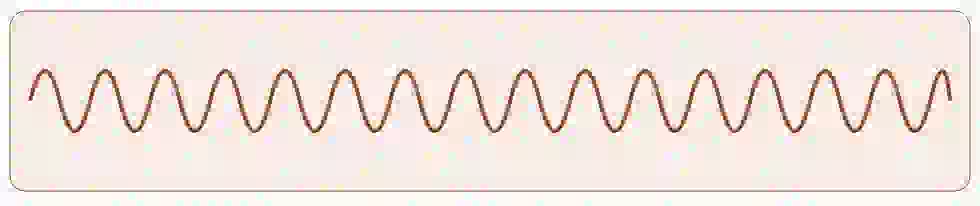
To me, it dit not feel natural to describe "fast vibrations" as "high" until I visualized it. The following images show the same one second window on two different waves. The first completes 100 full cycles in that second, a rate of 100 Hz, and we hear it as a low tone. The second crams 400 cycles into the same second, 400 Hz, and it reads as a high tone. Same stretch of time, more repetitions packed in, and the pitch just climbs. One of them is faster because it is going at a higher speed.
Seems like people didn't like talking about sound in vibration terms though. Notes, it turns out, are just labels. Every note name is a label stuck onto a frequency, a shortcut so nobody has to talk in hertz all day.
Not So Simple Sounds
In 1999, ANSI defined pitch as "that auditory attribute of sound according to which sounds can be ordered on a scale from low to high," and what's telling about that definition is what it leaves out: it never once mentions frequency. Turns out pitch has more ingredients than that. Loudness changes how a pitch sounds. So does the range it sits in, and so does whatever other frequencies happen to be stacked around it, and real sounds are almost never one clean waveform, they're complex, layered, messy. Pitch, in the end, is your brain's best guess at "low to high" after taking all of that in at once. Not a readout of a single number. Makes sense, right? The sounds around you are made of a multiple frequencies. Pluck a guitar string, hit a piano key, hum a note, and what you're actually hearing is a whole stack of frequencies at once, one loud one on the bottom, a bunch of quieter ones riding along on top.
Those other ones have a name: harmonics, additional frequencies showing up at whole-number multiples of the original. Hit an A at 440 Hz and traces of 880, 1320, and 1760 Hz come along for free, each one a little softer than the last. Almost nothing vibrates in one clean, simple mode, not really. A guitar string, a vocal cord, a bell, all of them shake at their base frequency and at higher frequencies at the same time, whether you meant for that to happen or not.
You can actually see this, which is the fun part. Using a spectrum analyzer, a tool to breaks a sound apart into every frequency hiding inside it, we can see the harmonics.
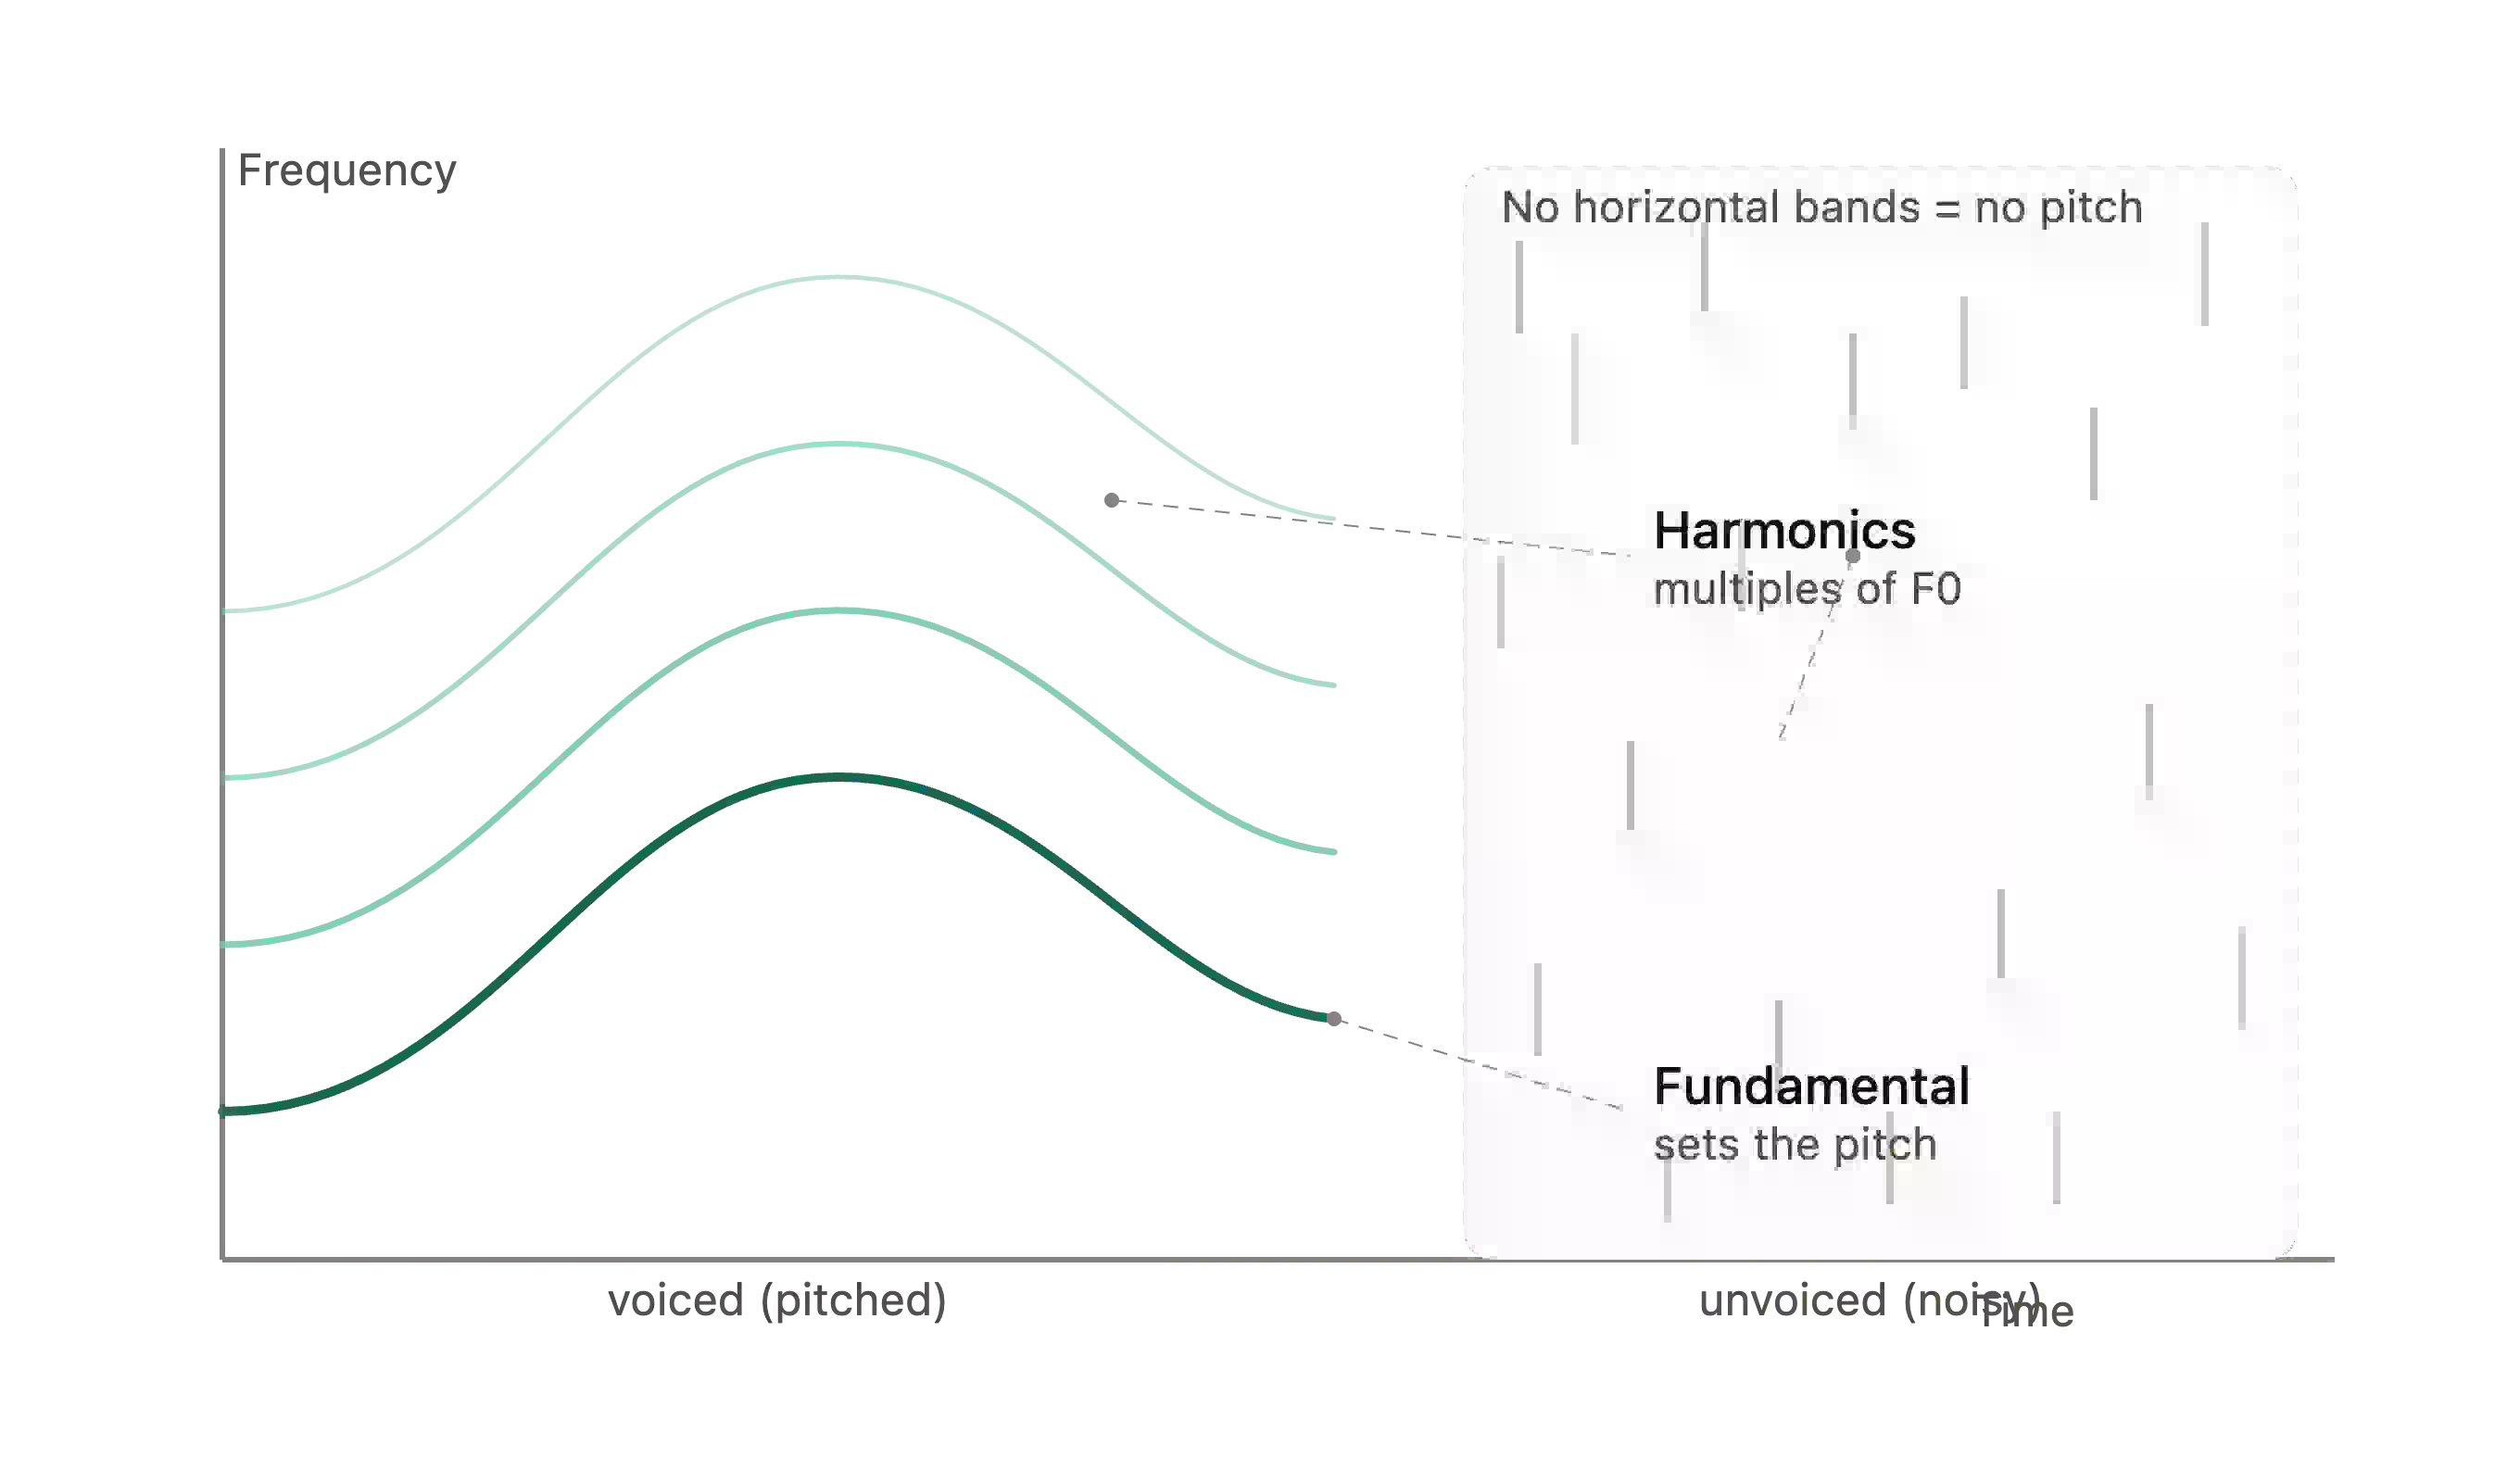
The green curve at the bottom is the fundamental. Its shape is the pitch contour, rising and falling the same way your voice does when you talk, and the fainter bands stacked right above it, curving in lockstep with that same shape, are the harmonics, evenly spaced multiples of the fundamental, dragged along wherever it goes. The smeared patch on the right has none of that structure. That's noise, energy spread unevenly across every frequency with nothing repeating, which is exactly why your ear hears a hiss instead of a note.
So which one is the note, then? With a whole stack of curving bands, is there even a single note to point to?
There is. It's called the fundamental frequency, the bottom curve in that spectrogram, the one every other band is a multiple of. That's the one your brain locks onto and calls "the note."
Think of it like a lead singer backed by a choir. The lead sings the melody, that's the fundamental, the note you'd hum back if someone asked. The choir behind them is the harmonics, layered in at higher pitches, not stealing the note, just coloring it. Swap the choir and the lead still sings the same note, but the whole thing feels completely different. Which is exactly why a piano A and a guitar A share a note and never sound alike: same fundamental, different choir.
Sounds through a Spectrogram
Quick side note: notes don't just have one number attached to them. Double a frequency and you land on the same note name again, just an octave higher, so a piano's A at 440 Hz has close relatives, 220 Hz an octave below, 880 Hz an octave above. Same letter, same note, different register.
Anyway, back to a simple sound wave. Picture the plainest sound there is, a single sine wave, nothing riding on top of it, no choir, just one pure tone, and if that wave vibrates 220 times a second, you already know the note: an A.
There's another way to look at that same wave, one that skips the up-and-down wiggle entirely and just asks which pitches are actually in there and how loud each one is. That's a frequency spectrum plot. If a regular waveform is basically a video of the air moving over time, a spectrum plot is more like a single photo of every pitch hiding inside the sound, lined up side by side by how high or low it sits.
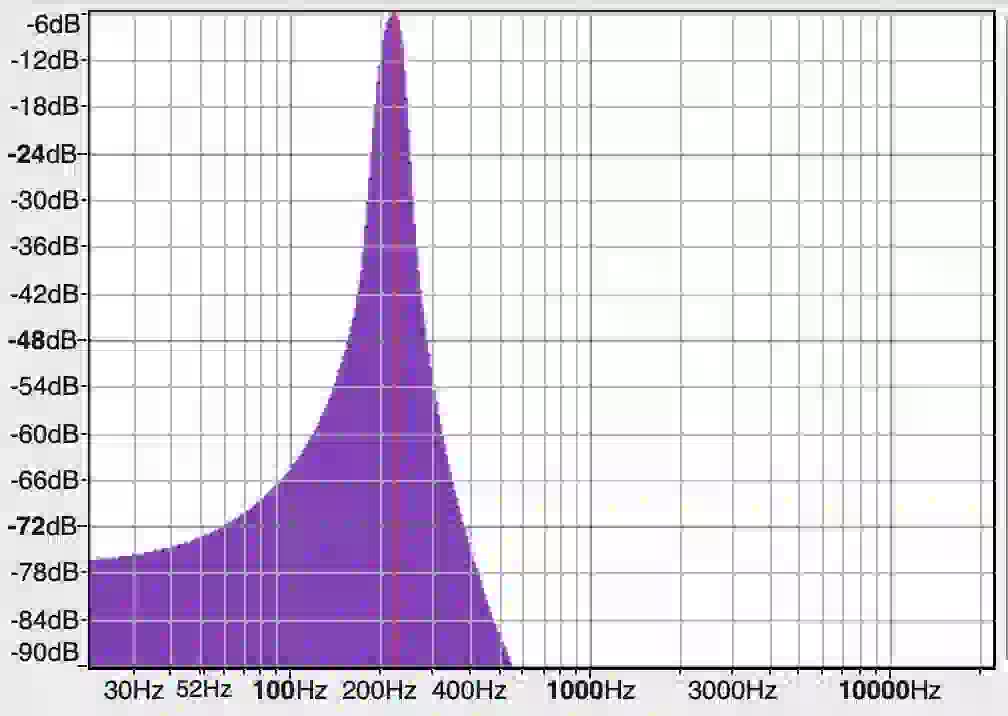
Here's that spectrum plot for our 220 Hz sine wave. Frequency runs along the bottom, from a low rumble on the left up to a screech on the right, spaced so equal steps mean doubling in pitch rather than equal jumps in Hz. Loudness runs up the side in decibels, flipped from what you'd expect, quiet at the bottom, loud climbing toward the top. Almost everywhere the wave has no energy at all, so the line just hugs the bottom near silence. Then, right around 220 Hz, it shoots up almost straight into a single sharp purple spike, peaks, and drops back into silence just as fast.
One peak, and nothing else. That's what a pure sine wave looks like from this angle, every bit of its energy piled onto a single frequency, nothing spilling over anywhere else. No smaller peaks scattered around it, no noise smeared across the graph, just the one pitch the wave actually is. The spike isn't a perfectly thin line only because of how the math behind the plot works, it smears a single frequency across a few neighboring points, but the idea holds: one frequency, one spike, one note.
Play that same A on a piano or a guitar instead of a synthesizer, and this plot looks completely different. You'd still see that tall spike at 220 Hz, sure, but next to it, smaller spikes at 440, 660, and 880 Hz, the harmonics again, each a little quieter than the last. Same note, same fundamental, but a different skyline of peaks around it, which is exactly why a piano A and a synth A never sound the same even when they're playing the identical pitch.
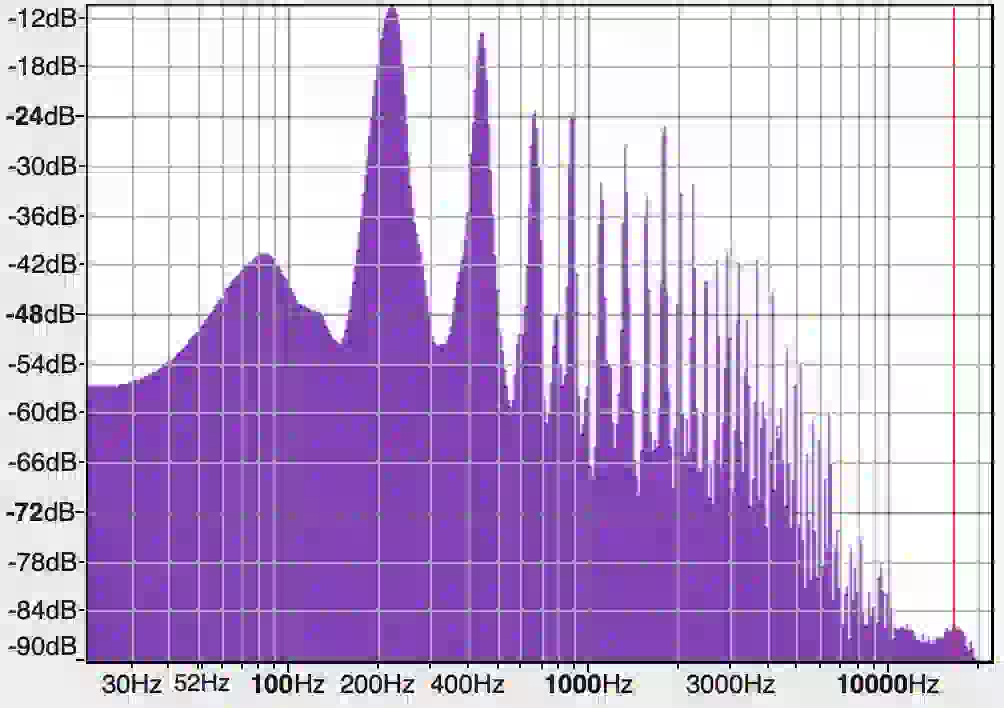
Here's what that actually looks like on a real piano. Instead of one lone spike, it's a whole forest of them, tallest on the left, shrinking as frequency climbs, spread from below 30 Hz out past 10,000 Hz. The tallest peak still sits close to 220 Hz, that's the fundamental, the pitch you'd actually name if someone asked what note is playing. Right after it, a second tall peak around double that, then a shorter one, then progressively shorter peaks at roughly even multiples all the way up the axis. That evenly spaced, shrinking ladder is the harmonic series, the same overtones from before, now stacked on a real fundamental. They only look like they're bunching closer together as frequency rises because the axis is logarithmic, in actual Hz they're still evenly spaced. Each harmonic is a touch quieter than the last, so the whole spectrum slopes downward in a staircase, from close to the fundamental's height down to the noise floor past 10 kHz. There's also a broader, lower hump around 50 to 90 Hz, well below the harmonics, and that one isn't a harmonic at all, it's resonance from the piano's own soundboard and body.
Where the sine wave was a single isolated needle, this staircase of peaks is what actually gives an instrument its timbre. The fundamental tells your ear the pitch; the harmonics riding above it are what make a piano sound like a piano instead of a flute or a synth, even on the exact same note.
If you want to make one of these yourself, Audacity does the job. Select the sound, open the Analyze menu, choose Spectral plot. That's the whole process, in version 3.7.8 at least, select the audio, then Analyze, then Spectral plot, and Audacity hands you the same frequency-versus-amplitude picture you've been looking at in this section.
A spectrogram shows something a spectral plot can't: time. Instead of one frozen snapshot of every frequency at once, it stretches time along the bottom, frequency up the side, and paints brightness wherever there's energy, moment by moment. Look at our 220 Hz sine wave this way and honestly, it's almost embarrassing how simple it looks.
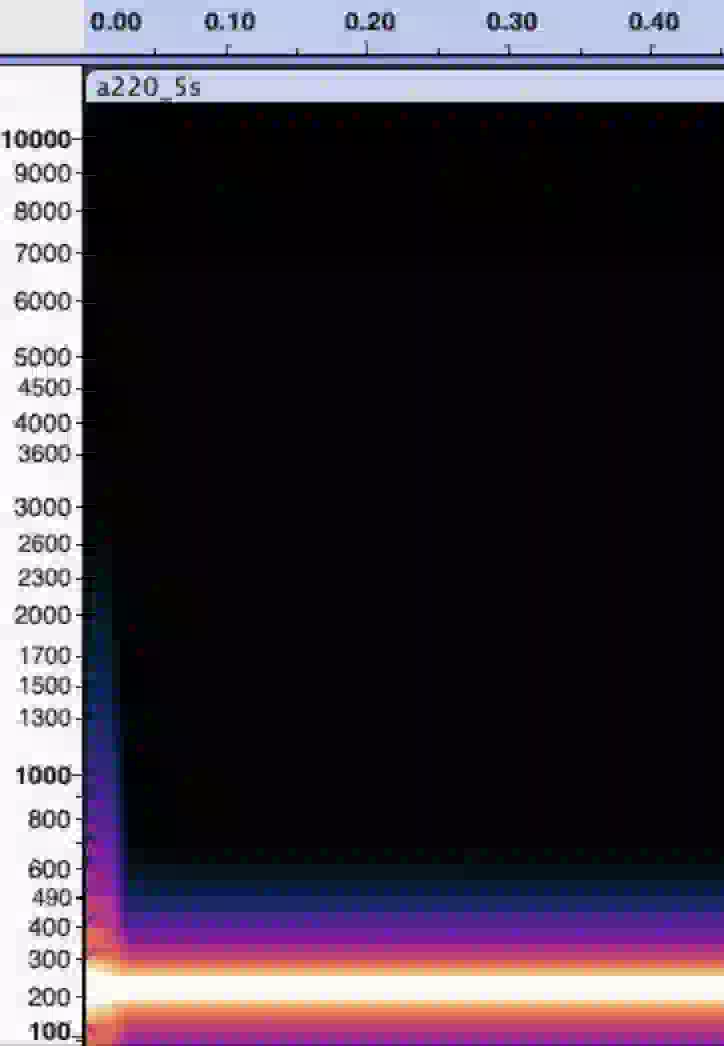
One clean, steady band sitting right at 220 Hz, unwavering, nothing but black silence above and below it. Now the same A, played on a piano.
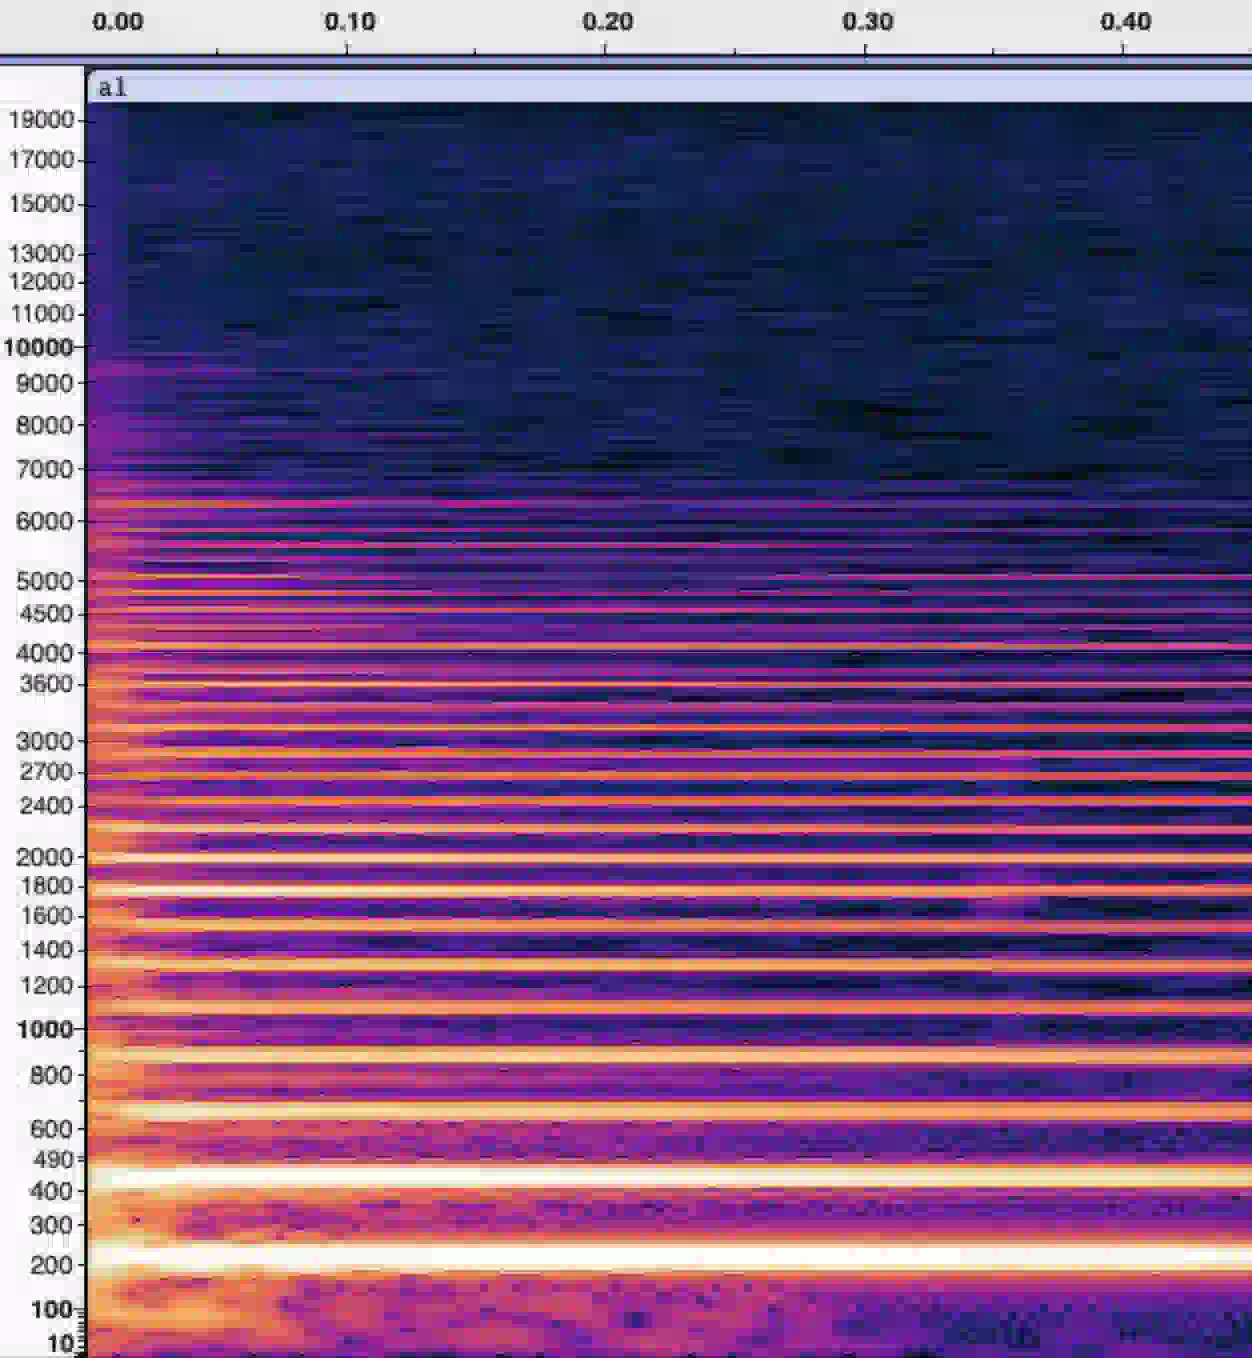
Instead of one band, it's a whole ladder of them: a bright line at 220 Hz, another almost as bright at 440, then thinner, fainter lines climbing at 660, 880, 1100 Hz and beyond, all perfectly horizontal, locked in step with each other. Near the top of the range those lines dissolve into a hazy wash of noise, too faint and too close together to read as individual harmonics anymore. Same instant, same note, but where the sine wave gives you a single thread, the piano gives you the whole harmonic ladder, held steady over time.
And that's also the exact mess a tuner app has to untangle every time it listens to anything more complicated than a lab tone. Which, it turns out, is where my own tuner started falling apart.
How Tuner Apps Work
Somewhere inside every tuner app, and inside Audacity's Spectral plot button too, sits an algorithm called the Fast Fourier Transform, or FFT, the actual machinery that turns a wall of raw audio samples into a picture of frequency versus amplitude. Credit for it usually goes to James Cooley and John Tukey, and IEEE Spectrum notes that "the FFT is a computer algorithm that was first demonstrated in 1964 by IEEE Fellows John Tukey and James W. Cooley," with the two of them formalizing it by 1965 at IBM Research and Princeton, cutting the time it took to compute a Fourier transform down drastically. Part of the push behind it, weirdly enough, was a Cold War problem: buried in the math was a faster way to sift through seismograph data and tell a Soviet underground nuclear test apart from an ordinary earthquake, without the long wait a slow calculation demanded.
The idea itself is older than either of them, though. One history of the FFT points out that the technique was "prefigured in Carl Friedrich Gauss's unpublished 1805 work on the orbits of asteroids Pallas and Juno," where Gauss landed on an equivalent method for trigonometric interpolation. He just never worked out how fast it ran, or bothered to publish it. In 1942, G. C. Danielson and Cornelius Lanczos found a similar shortcut on their own, aimed at a narrower problem, making Fourier transforms fast enough to be useful in x-ray crystallography. What Cooley and Tukey actually did wasn't discovering the trick. It was turning it into a general algorithm fast enough to run on anything, which is the version still running quietly under the hood of every tuner app.
The idea that algorithm rests on is a strange one to sit with, honestly: any complex, real-world sound can be broken down into a sum of simple sine waves, each with its own frequency, amplitude, and phase. The diagram below shows that in reverse. Three clean sine waves, a low, a medium, a high frequency component, get added together, and the result is the lumpy, complicated wave you'd actually see on an oscilloscope or record with a mic.
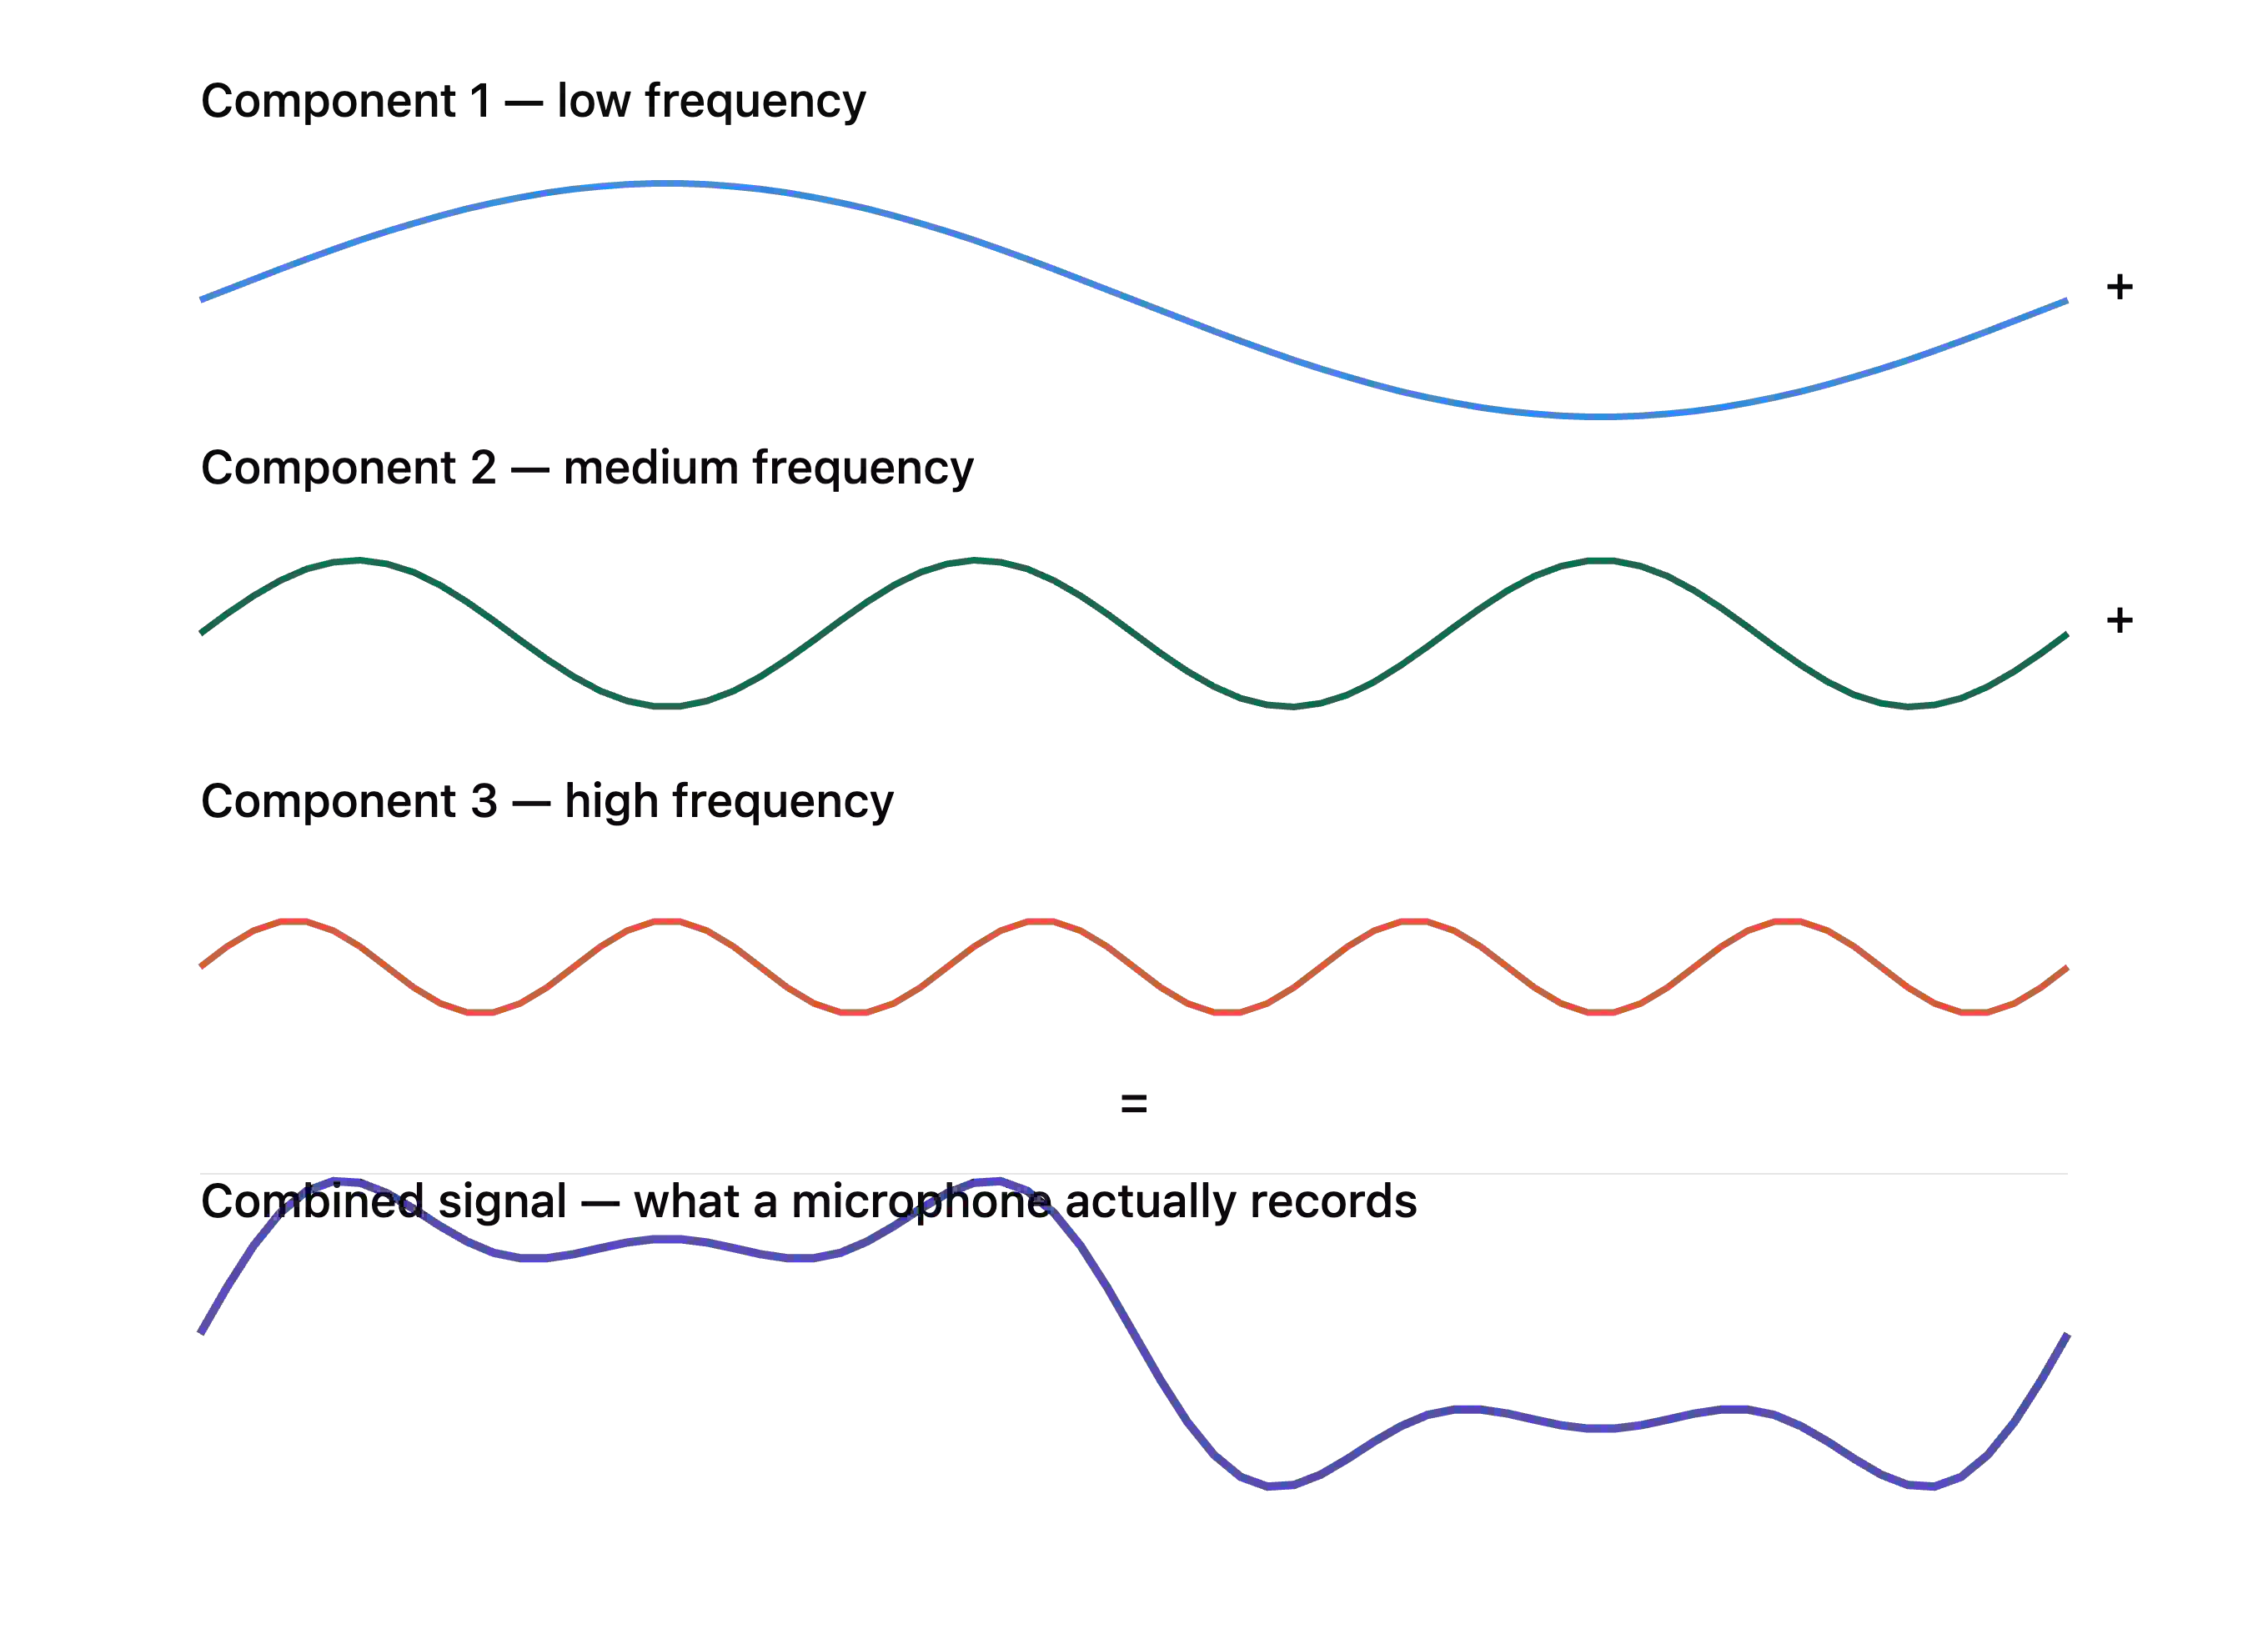
The Fourier Transform runs that process backward. Given the messy combined wave, the thing a microphone actually hands you, it works out which sine waves, at which frequencies and strengths, got added together to build it. The Fast Fourier Transform is just an efficient way to compute that. A naive approach would take a number of steps proportional to N squared for N samples; the FFT gets it down to roughly N log N, splitting the problem in half over and over, even-indexed samples against odd-indexed samples, recursively, then recombining the results. That difference in efficiency is the whole reason a phone can run this in real time instead of chewing on it for a few seconds.
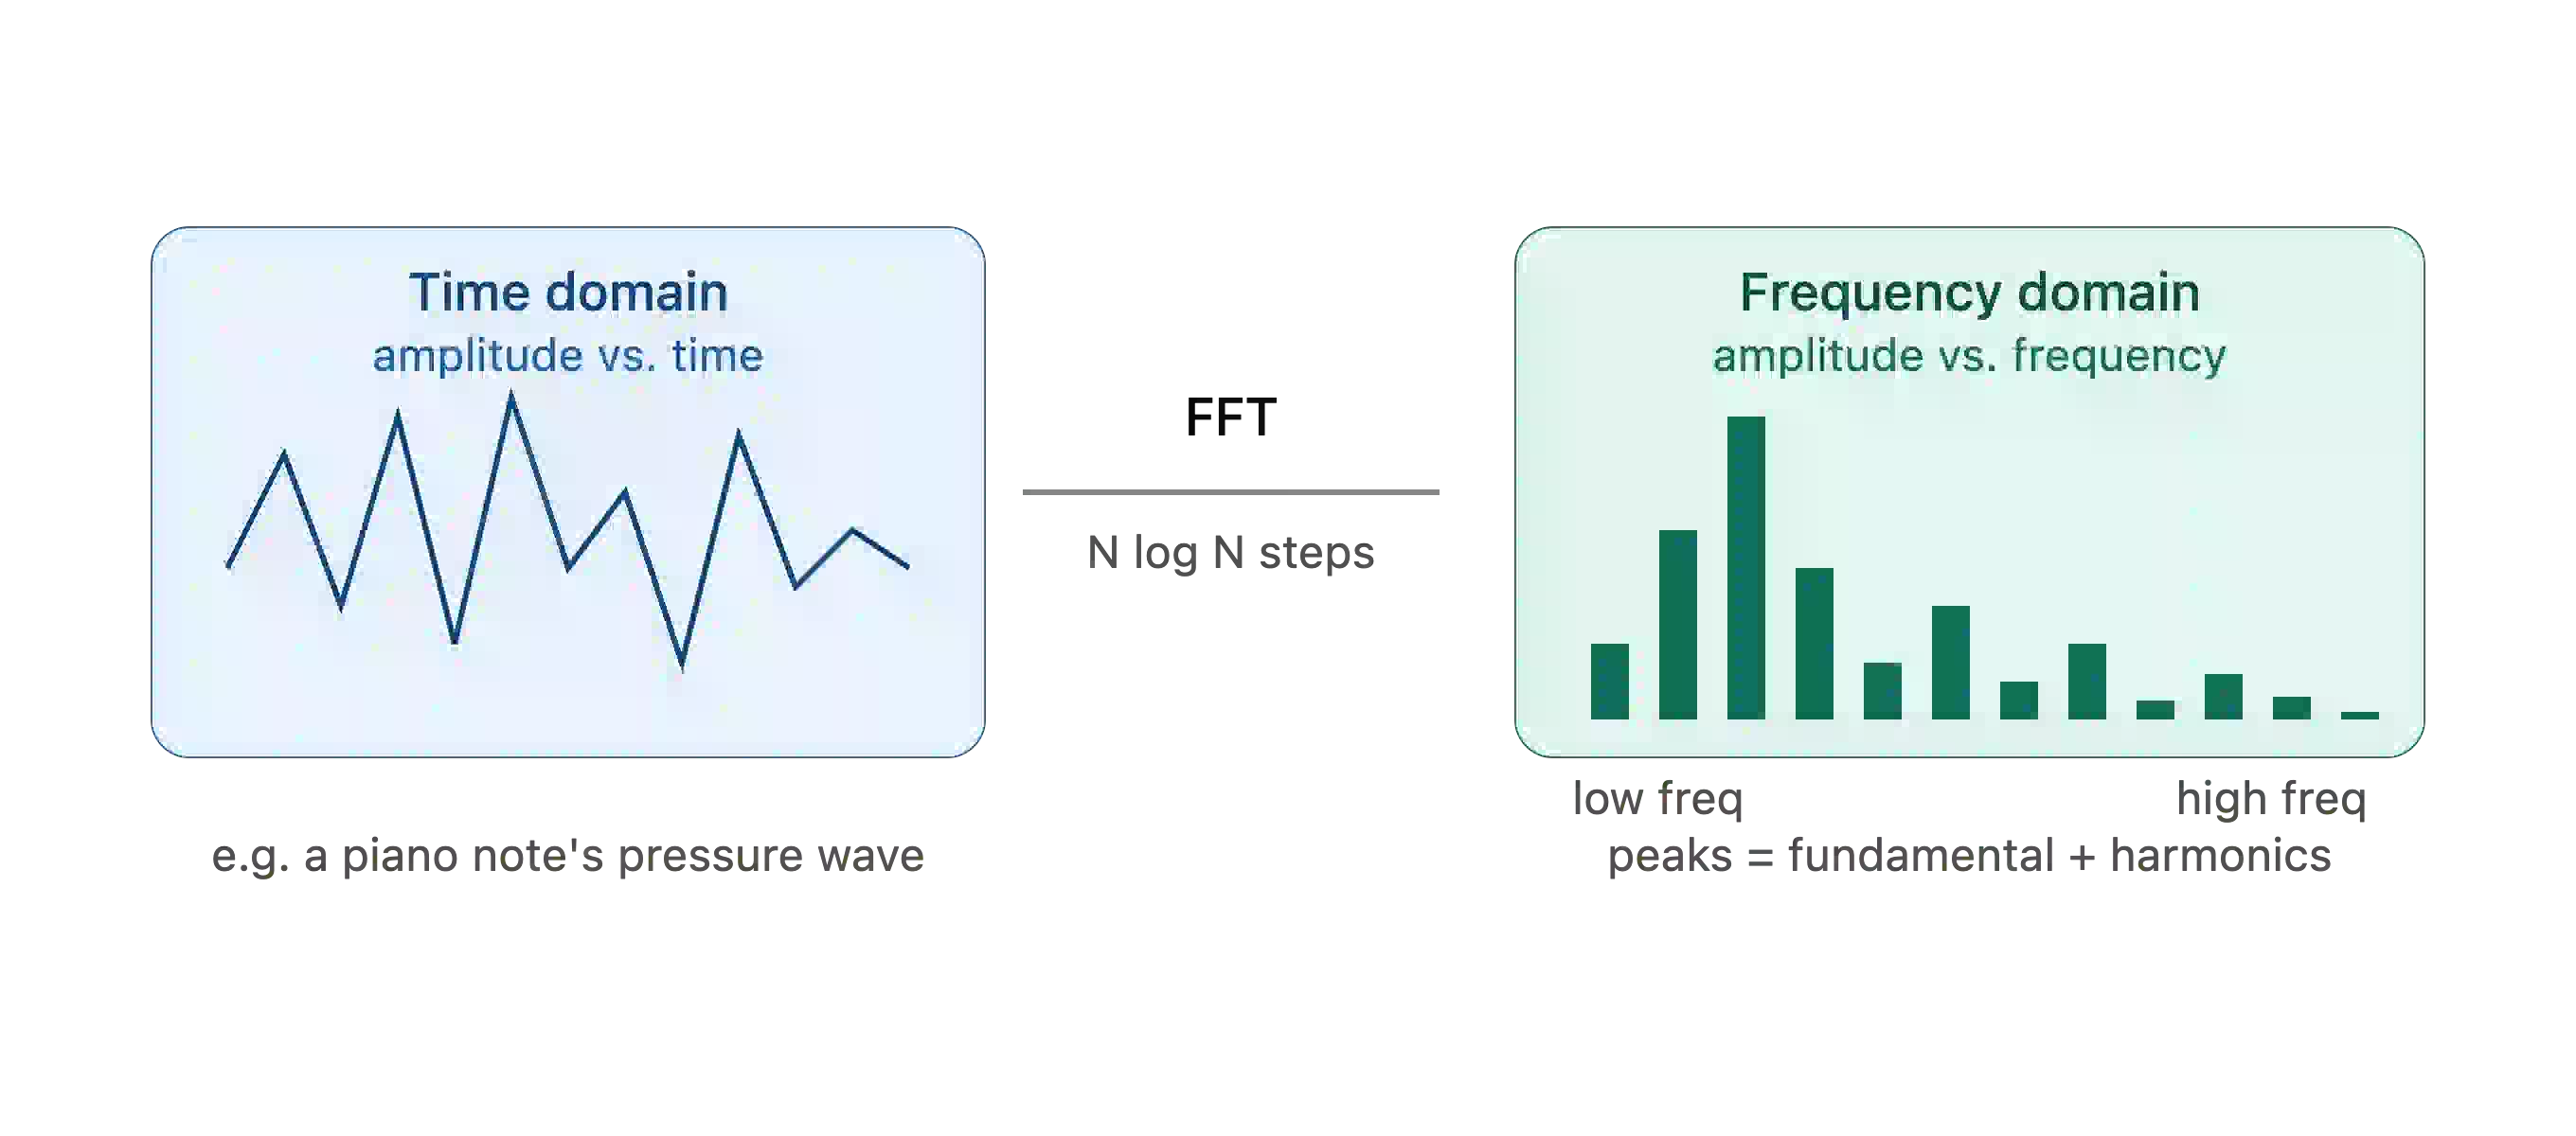
That's the entire pipeline running inside a tuner app, honestly. It grabs a short slice of the raw, wiggly waveform coming off the microphone, feeds it through the FFT, and gets back a bar for every frequency showing how strong that component is, the exact spectrum plots from earlier in this post, where the sine wave gave you a single bar and the piano gave you a fundamental plus a decaying staircase of harmonics.
There's a catch worth knowing, though. The FFT gives you frequency content, but it throws away when any of it happened inside that window, you get "these frequencies were present," never their timing. Which is exactly why the spectrogram from earlier exists. It runs the FFT over and over, on many short, overlapping windows, and stitches the results side by side, handing frequency and time back to you together.
And with time comes a new dimension: how long should each of those windows actually be?
Depends what you're optimizing for, but in practice it usually lands somewhere between about 10 and 100 milliseconds. At a standard 44.1 kHz sample rate, common FFT window sizes work out to round numbers in samples: 512 samples is about 11.6 ms, 1024 about 23.2 ms, 2048 about 46.4 ms, 4096 about 92.9 ms.
Why not just pick one and be done with it? Because there's a real trade-off buried in there, sometimes called the time-frequency uncertainty principle, a cousin of the same math behind Heisenberg uncertainty, though the stakes here are, thankfully, a lot lower. Shorter windows give better time resolution, you can see fast transients like a drum hit or a plucked string's attack clearly, but worse frequency resolution, so nearby pitches blur together and a low note might not even complete a full cycle inside the window. Longer windows flip that trade: sharper, more precise frequency peaks, better at telling apart notes that sit close together, but anything that changes quickly gets smeared out.
That's why a guitar tuner and a spectrogram make different choices even though they're both running the same FFT under the hood. A guitar tuner wants pitch nailed down precisely and doesn't care much about millisecond-level timing, so it can afford a longer window, often 4096 samples or more, sometimes averaged across several windows, for a stable reading. A spectrogram built for something like speech or music production usually goes the other way, shorter windows around 1024 to 2048 samples with heavy overlap between them, so it can still track fast changes without losing too much frequency precision.
The rule of thumb: give the window enough room for at least a few full cycles of the lowest frequency you care about. Take that 220 Hz sine wave from earlier, one cycle takes about 4.5 milliseconds, so even an 11.6 millisecond window fits a couple of full cycles comfortably. A 55 Hz bass note is a different story; getting a clean read on that needs something closer to 50 or 100 milliseconds.
Looping through Frames to Get the Note
So here's the actual loop running inside a tuner app, frame by frame: grab a short window of audio, run it through the FFT, find the peaks in the resulting spectrum, decide which peak is the note. Slide the window forward a little, do it again. And again, dozens of times a second, stitching those individual guesses into whatever number the display shows you.
That last step, deciding which peak is the note, is easy on a clean piano recording, where one tall peak sits far above everything else. It's a whole different problem on a real recording.
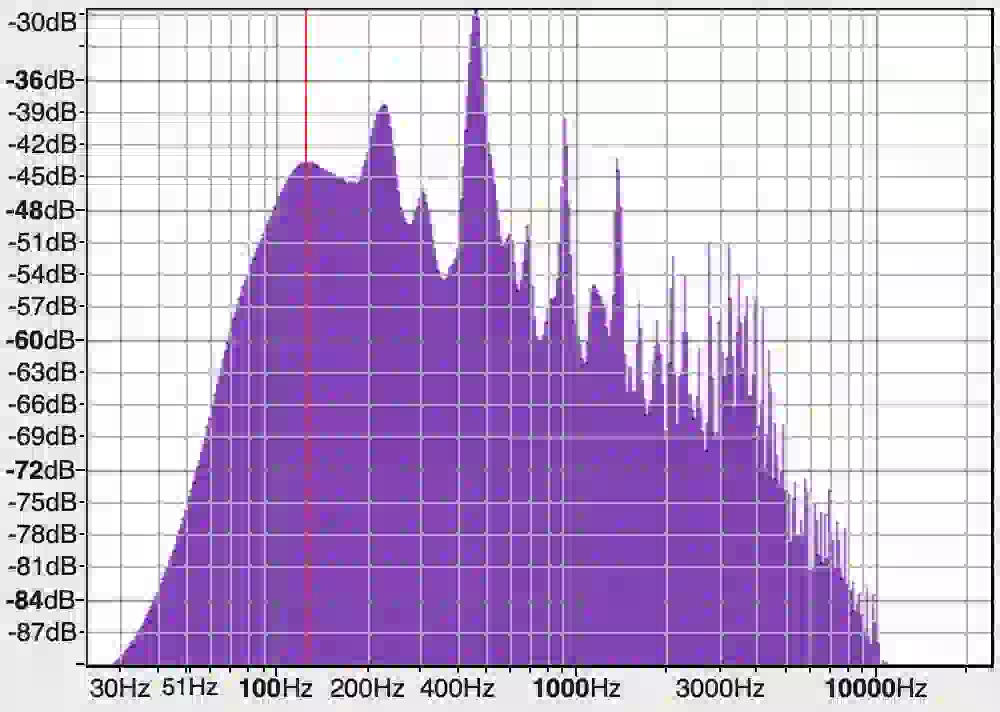
This is a single frame pulled from the actual Chanel Tres and James Blake clip that started this whole search, one slice of one of James Blake's glitchy square wave notes, run through the same spectral plot as everything else in this post. Instead of the clean, evenly spaced staircase the piano gave us, it's a dense, uneven pile of peaks, a broad hump low down, a few competing bumps around 200 and 400 Hz, then a spiky comb of narrower peaks climbing all the way past 10,000 Hz. The tallest peak in the whole frame sits around 457 Hz, close enough to call it an A, one guess pulled out of a crowd of plausible peaks, made dozens of times a second. That's the exact fog my own tuner app was stuck in.
So What Pitch Was It?
Back to the original question, then: what pitch was my synth actually playing?
Sometimes, a clean one. A held note from the Softpop 2 sits at one frequency with a normal harmonic stack behind it, and a tuner can read that in a couple of frames without blinking. But my loop wasn't that. It was two square waves sliding past each other, bending mid-note, closer to that Chanel Tres and James Blake frame above than a plucked guitar string, a crowd of competing peaks, no single one tall enough to call, shifting shape before the algorithm could ever settle on a firm read. The blank screen wasn't the app breaking. It was the app running its usual loop, a window, an FFT, a search for peaks, and honestly reporting back that this time, there wasn't a clean winner.
That's the part I didn't see coming. Pitch isn't a number sitting there waiting to be measured, it's a guess, made by your brain or by a tuner's algorithm, about a pile of frequencies, and sometimes that pile resolves cleanly into one note. Sometimes it doesn't. And no app, no matter how fast its FFT, can hand you an answer that was never there to find.
Which, weirdly, tracks. That glitchy, in-between, halfway-tuned sound was never going to settle into one clean note, and honestly, that's exactly what made the original loop click in the first place. Not a wrong note. Just a vibe.